Market Outlook
April 10, 2017
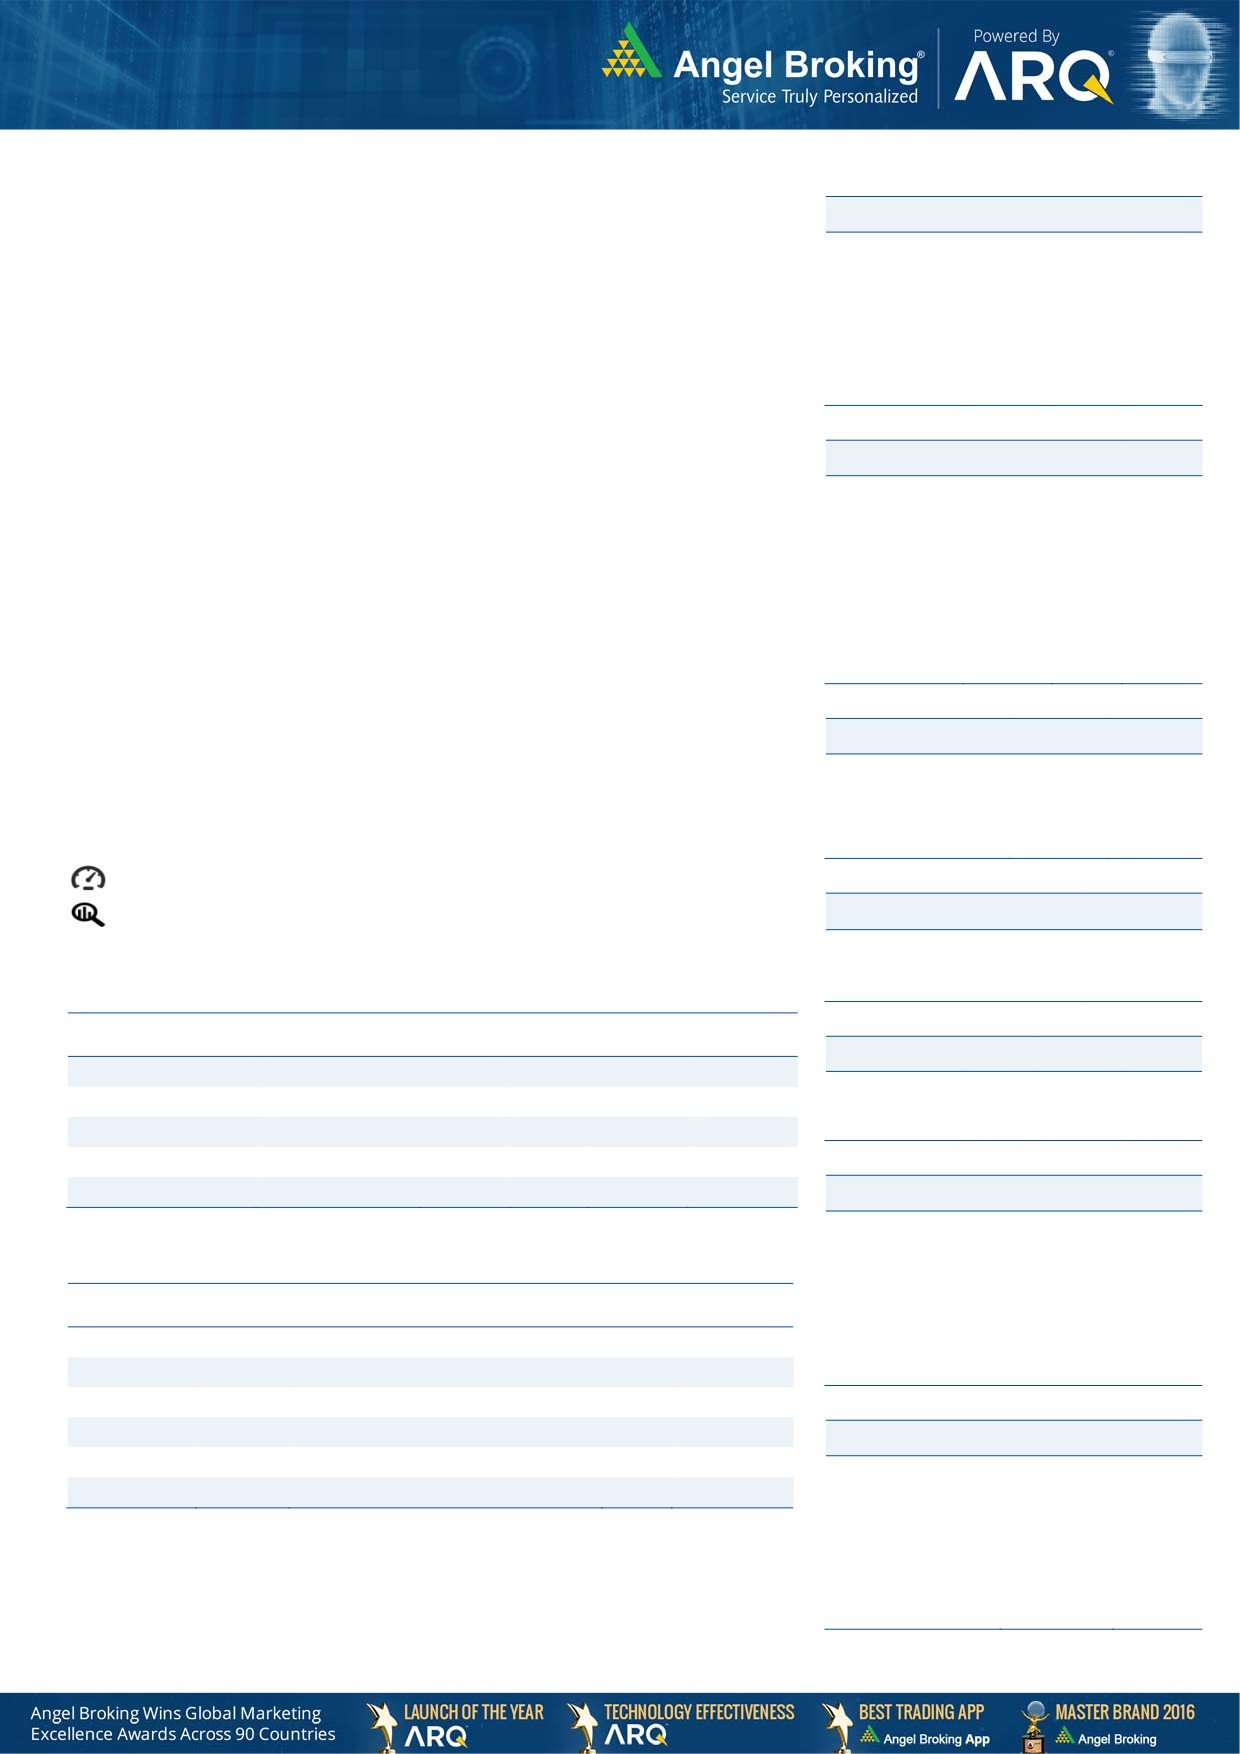
Market Cues
Domestic Indices
Chg (%)
(Pts)
(Close)
Indian markets are likely to open flat tracking the SGX Nifty & global cues.
BSE Sensex
(0.7)
(221)
29,707
US markets remained lackluster during the day and closed on flattish note after a
Nifty
(0.7)
(64)
9,198
mixed job data. The labor department said non farm payroll employment climbed
Mid Cap
(0.3)
(43)
14,233
by 98,000 jobs in March after surging up by a revised 2,19,000 jobs in February.
Small Cap
(0.5)
(70)
14,681
Economist had expected drop in unemployment rate.
Bankex
(1.0)
(237)
24,423
The European markets saw a choppy trading session on Friday but most of the
Indices closed on positive note for the day. While initially geopolitical concerns
Global Indices
Chg (%)
(Pts)
(Close)
impacted the sentiment of investors across different countries and gold prices saw up
move, the negative impact of the same on global equities was limited.
Dow Jones
(0.0)
(6)
20,656
Nasdaq
(0.0)
(1)
5,877
The Indian markets witnessed selling pressure and closed on a sharply negative note
FTSE
0.6
46
7,349
with NIFTY closing down by 64 points while Sensex closing down by 221 points. The
Nikkei
0.4
68
18,665
US attacked on Syria resulted in nervousness in the global markets and crude oil
prices spiked before settling down and this resulted in the nervousness in the Indian
Hang Seng
(0.0)
(6)
24,267
markets also.
Shanghai Com
0.2
6
3,287
News Analysis
Advances / Declines
BSE
NSE
RBI proposes long term finance banks
Advances
1,265
648
Detailed analysis on Pg2
Declines
1,663
1042
Investor’s Ready Reckoner
Unchanged
135
72
Key Domestic & Global Indicators
Volumes (` Cr)
Stock Watch: Latest investment recommendations on 150+ stocks
Refer Pg5 onwards
BSE
4,362
NSE
28,155
Top Picks
CMP
Target
Upside
Company
Sector
Rating
(`)
(`)
(%)
Net Inflows (` Cr)
Net
Mtd
Ytd
Blue Star
Capital Goods
Accumulate
661
760
14.9
FII
(262)
322
44,543
Dewan Housing Fin. Financials
Buy
383
460
20.0
MFs
415
611
10,049
Mahindra Lifespace
Real Estate
Buy
407
522
28.1
Navkar Corporation Others
Buy
209
265
26.5
KEI Industries
Capital Goods
Accumulate
191
207
8.3
Top Gainers
Price (`)
Chg (%)
More Top Picks on Pg3
Adanitrans
81
7.0
Concor
1,120
6.5
Key Upcoming Events
Previous
Consensus
Abb
1,381
6.1
Date
Region
Event Description
Reading
Expectations
Edelweiss
182
6.0
Apr 11, 2017 US
Unnemployment rate
4.70
4.70
Apr 12, 2017 UK
Jobless claims change
-11.30
--
Mfsl
633
5.2
Apr 12, 2017 US
Initial Jobless claims
234.00
--
Apr 12, 2017 India
Industrial Production YoY
2.70
1.40
Top Losers
Price (`)
Chg (%)
Apr 13, 2017 China
Consumer Price Index (YoY)
0.80
1.00
Jpassociat
13
(7.6)
Apr 13, 2017 India
Imports YoY%
21.76
--
Unitech
6
(6.0)
More Events on Pg4
Religare
218
(5.2)
Jetairways
497
(4.5)
Cox&Kings
212
(4.1)
As on April 07, 2017
Market Outlook
April 10, 2017
News Analysis
RBI proposes long term finance banks
In order to solve the funding issues of long gestation projects the RBI has proposed
setting up of long term finance banks. The RBI had come out saying new banking
licenses will be on tap during August 2016 and the same will be applicable for the
long term fiancé banks also. The eligibility criteria for them also will be same as
other commercial banks. However, certain regulations and regulatory
requirements for these banks will be different from the commercial banks.
The RBI has proposed a minimum capital requirement of `1,000cr for the long
term finance banks compared to `500cr for the commercial banks. However,
looking at the challenges in log term financing the RBI might give some relaxation
on CRR, though it has been proposed to be kept. Exemption from SLR may also be
considered. In order to give further relaxation these banks might also be given
exemptions from the compliance of PSL & rural branch opening, liquidity coverage
ratio etc.
While it is too early to say on this issue, there exists a vast untapped opportunity for
long term financing in India. Looking at the scale of infrastructure projects we
thing selective specialized NBFC could take the opportunity of migrating Long
Term Finance Banks as and when more clarity on it comes.
Economic and Political News
CREDAI members launch 375 affordable housing projects
India, Bangladesh to sign investments pacts worth $ 9 bn
Undisclosed income worth `5400cr detected till Jan,10
Card payments over 2 lakhs to be show in ITR
Ministers asked to submit achievements on 3rd anniversary of Mdi Govt
Corporate News
Cairn Energy gets fresh demand note of `10,247cr from tax department
Tata Motor’s JLR clocks 16% growth in sales at 6,04,009 units in FY17
Religare Enterprises to exit Religare Health insurance for `1,040cr
Tata Motors aims to be no 3 car maker by 2019
Market Outlook
April 10, 2017
Top Picks ★★★★★
Market Cap
CMP
Target
Upside
Company
Rationale
(` Cr)
(`)
(`)
(%)
Strong growth in domestic business due to its leadership in
Alkem Laboratories
26,328
2,202
2,311
5.0
acute therapeutic segment. Alkem expects to launch more
products in USA, which bodes for its international business.
We expect the company would report strong profitability
Asian Granito
1,137
378
390
3.2
owing to better product mix, higher B2C sales and
amalgamation synergy..
Among the top 4 players in the consumer durables segment.
Bajaj Electricals
3,480
344
395
15.0
Improved profitability backed by turn around in E&P segment.
Strong order book lends earnings visibility.
Favourable outlook for the AC industry to augur well for
Cooling products business which is out pacing the market
Blue Star
6,320
661
760
14.9
growth. EMPPAC division's profitability to improve once
operating environment turns around..
With a focus on the low and medium income (LMI) consumer
Dewan Housing Finance
12,006
383
460
20.0
segment, the company has increased its presence in tier-II &
III cities where the growth opportunity is immense.
Strong loan growth backed by diversified loan portfolio and
Equitas Holdings
5,586
165
235
42.1
adequate CAR. ROE & ROA likely to remain decent as risk of
dilution remains low. Attractive valuations considering growth.
Economic recovery to have favourable impact on advertising
& circulation revenue growth. Further, the acquisition of a
Jagran Prakashan
6,105
187
225
20.5
radio business (Radio City) would also boost the company's
revenue growth.
High order book execution in EPC segment, rising B2C sales
KEI Industries
1,487
191
207
8.3
and higher exports to boost the revenues and profitability
Speedier execution and speedier sales, strong revenue visibilty
Mahindra Lifespace
1,673
407
522
28.1
in short-to-long run, attractive valuations
Higher growth in domestic branded sales and healthy export
Mirza International
1,045
87
107
23.1
to boost the profitability.
Massive capacity expansion along with rail advantage at ICD
Navkar Corporation
2,987
209
265
26.5
as well CFS augurs well for the company
Strong brands and distribution network would boost growth
Siyaram Silk Mills
1,586
1,692
1,872
10.7
going ahead. Stock currently trades at an inexpensive
valuation.
Market leadership in Hindi news genre and no. 2 viewership
ranking in English news genre, exit from the radio business,
TV Today Network
1,655
277
344
24.0
and anticipated growth in ad spends by corporates to benefit
the stock.
Source: Company, Angel Research
Market Outlook
April 10, 2017
Key Upcoming Events
Global economic events release calendar
Bloomberg Data
Date
Time
Country
Event Description
Unit
Period
Last Reported
Estimated
Apr 11, 2017
6:00 PM US
Unnemployment rate
%
Mar
4.70
4.70
Apr 12, 2017
2:00 PM UK
Jobless claims change
% Change
Mar
-11.30
6:00 PM US
Initial Jobless claims
Thousands
Apr 8
234.00
5:30 PM India
Industrial Production YoY
% Change
Feb
2.70
1.40
Apr 13, 2017
7:00 AM China
Consumer Price Index (YoY)
% Change
Mar
0.80
1.00
India
Imports YoY%
% Change
Mar
21.76
India
Exports YoY%
% Change
Mar
17.48
US
Producer Price Index (mom)
% Change
Mar
0.10
China
Exports YoY%
% Change
Mar
-1.30
3.40
Apr 14, 2017
6:00 PM US
Consumer price index (mom)
% Change
Mar
0.10
0.00
Apr 17, 2017
12:00 PM India
Monthly Wholesale Prices YoY%
% Change
Mar
6.55
6.04
7:30 AM China
Industrial Production (YoY)
% Change
Mar
6.00
6.30
7:30 AM China
Real GDP (YoY)
% Change
1Q
6.80
6.80
Apr 18, 2017
6:00 PM US
Housing Starts
Thousands
Mar
1288.00
1280.00
6:45 PM US
Industrial Production
%
Mar
0.11
0.50
6:00 PM US
Building permits
Thousands
Mar
1216.00
1260.00
April 19, 2017
2:30 PM Euro Zone Euro-Zone CPI (YoY)
%
Mar F
1.50
Apr 20, 2017
7:30 PM Euro Zone Euro-Zone Consumer Confidence
Value
Apr A
-5.00
Apr 21, 2017
1:00 PM Germany PMI Services
Value
Apr P
55.60
1:00 PM Germany PMI Manufacturing
Value
Apr P
58.30
7:30 PM US
Existing home sales
Million
Mar
5.48
5.55
Apr 25, 2017
7:30 PM US
Consumer Confidence
S.A./ 1985=100 Apr
125.60
124.00
7:30 PM US
New home sales
Thousands
Mar
592.00
590.00
Source: Bloomberg, Angel Research
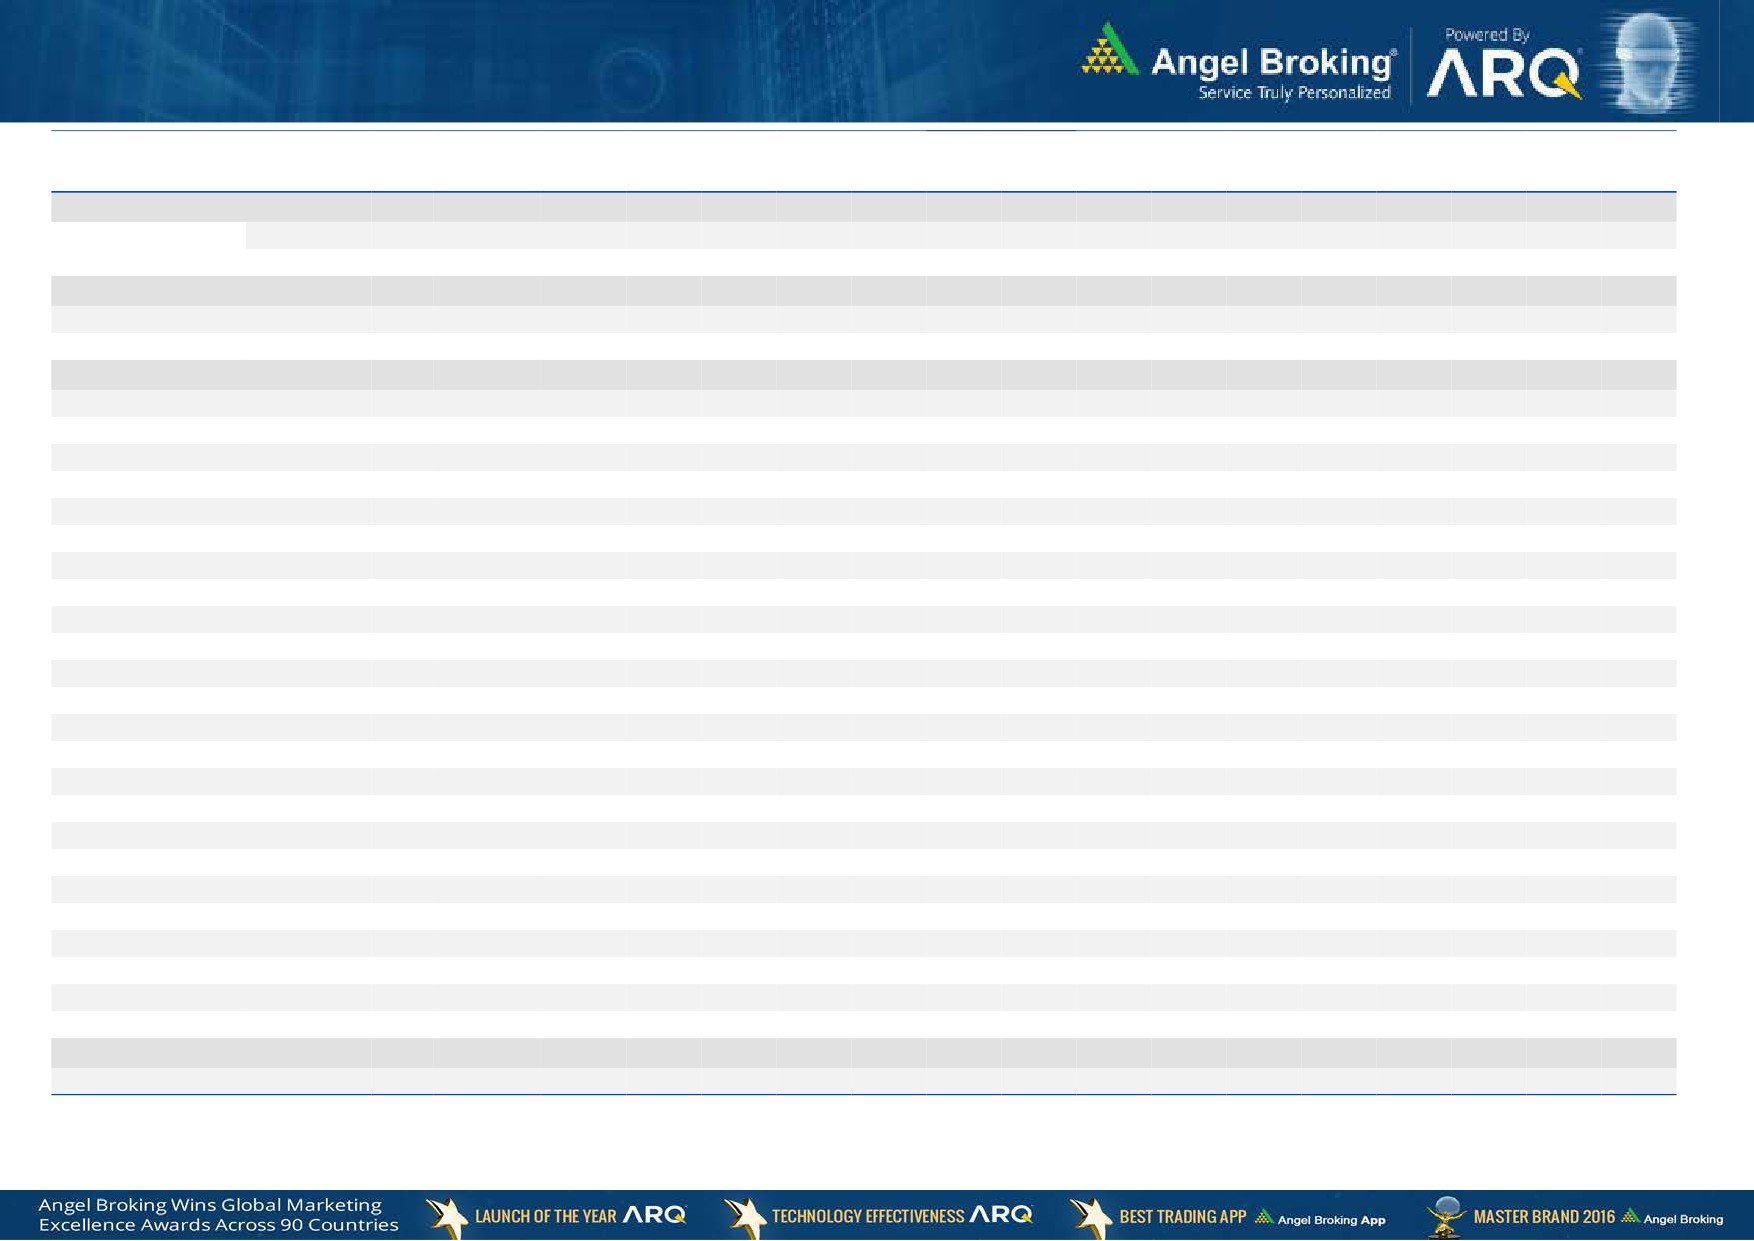
Stock Watch
April 10, 2017
Company Name
Reco
CMP
Target
Mkt Cap
Sales ( Čcr )
OPM(%)
EPS (Č)
PER(x)
P/BV(x)
RoE(%)
EV/Sales(x)
(Č)
Price ( Č)
( Č cr )
FY17E
FY18E
FY17E
FY18E
FY17E
FY18E
FY17E
FY18E
FY17E
FY18E
FY17E
FY18E
FY17E
FY18E
6,577.0
6,907.0
Agri / Agri Chemical
Rallis
Neutral
250
-
4,868
1,937
2,164
13.3
14.3
9.0
11.0
27.8
22.8
4.8
4.2
18.4
19.8
2.6
2.3
United Phosphorus
Neutral
726
-
36,815
15,176
17,604
18.5
18.5
37.4
44.6
19.4
16.3
3.8
3.2
21.4
21.2
2.5
2.1
Auto & Auto Ancillary
Ashok Leyland
Buy
84
111
23,792
20,021
21,915
11.6
11.9
4.5
5.3
18.6
15.7
3.8
3.4
20.6
21.5
1.1
1.0
Bajaj Auto
Neutral
2,833
-
81,969
25,093
27,891
19.5
19.2
143.9
162.5
19.7
17.4
5.5
4.8
30.3
29.4
3.0
2.6
Bharat Forge
Neutral
1,067
-
24,835
7,726
8,713
20.5
21.2
35.3
42.7
30.2
25.0
5.6
5.0
18.9
20.1
3.3
2.9
Eicher Motors
Neutral
25,807
-
70,221
16,583
20,447
17.5
18.0
598.0
745.2
43.2
34.6
14.8
11.2
41.2
38.3
4.1
3.2
Gabriel India
Neutral
124
-
1,780
1,544
1,715
9.0
9.3
5.4
6.3
23.0
19.7
4.3
3.8
18.9
19.5
1.1
1.0
Hero Motocorp
Accumulate
3,217
3,446
64,234
28,083
30,096
15.3
15.7
171.8
187.0
18.7
17.2
6.5
5.5
30.1
27.9
2.1
1.9
Jamna Auto Industries Neutral
221
-
1,762
1,486
1,620
9.8
9.9
15.0
17.2
14.7
12.9
3.2
2.7
21.8
21.3
1.3
1.1
L G Balakrishnan & Bros Neutral
620
-
973
1,302
1,432
11.6
11.9
43.7
53.0
14.2
11.7
2.0
1.8
13.8
14.2
0.8
0.8
Mahindra and Mahindra Neutral
1,276
-
79,255
46,534
53,077
11.6
11.7
67.3
78.1
19.0
16.4
3.1
2.7
15.4
15.8
1.7
1.4
Maruti
Neutral
6,264
-
189,221
67,822
83,288
16.0
16.4
253.8
312.4
24.7
20.1
5.7
4.6
23.0
22.9
2.5
1.9
Minda Industries
Neutral
438
-
3,475
2,728
3,042
9.0
9.1
68.2
86.2
6.4
5.1
1.5
1.2
23.8
24.3
1.3
1.2
Motherson Sumi
Neutral
379
-
53,126
45,896
53,687
7.8
8.3
13.0
16.1
29.0
23.5
9.4
7.5
34.7
35.4
1.2
1.0
Rane Brake Lining
Neutral
1,011
-
800
511
562
11.3
11.5
28.1
30.9
36.0
32.7
5.5
5.0
15.3
15.0
1.7
1.6
Setco Automotive
Neutral
37
-
498
741
837
13.0
13.0
15.2
17.0
2.5
2.2
0.4
0.4
15.8
16.3
1.1
1.0
Tata Motors
Neutral
468
-
135,128
300,209
338,549
8.9
8.4
42.7
54.3
11.0
8.6
1.8
1.5
15.6
17.2
0.6
0.5
TVS Motor
Neutral
469
-
22,258
13,390
15,948
6.9
7.1
12.8
16.5
36.7
28.3
9.1
7.2
26.3
27.2
1.7
1.4
Amara Raja Batteries
Accumulate
891
1,009
15,213
5,305
6,100
16.0
16.3
28.4
34.0
31.4
26.2
6.1
5.1
19.3
19.3
2.9
2.5
Exide Industries
Neutral
225
-
19,121
7,439
8,307
15.0
15.0
8.1
9.3
27.8
24.2
3.9
3.5
14.3
16.7
2.2
2.0
Apollo Tyres
Accumulate
213
235
10,830
12,877
14,504
14.3
13.9
21.4
23.0
9.9
9.3
1.5
1.3
16.4
15.2
1.0
0.9
Ceat
Accumulate
1,375
1,450
5,564
7,524
8,624
13.0
12.7
131.1
144.3
10.5
9.5
1.9
1.6
19.8
18.6
0.8
0.7
JK Tyres
Neutral
137
-
3,107
7,455
8,056
15.0
15.0
21.8
24.5
6.3
5.6
1.3
1.1
22.8
21.3
0.5
0.5
Swaraj Engines
Neutral
1,496
-
1,858
660
810
15.2
16.4
54.5
72.8
27.5
20.6
8.6
7.8
31.5
39.2
2.6
2.1
Subros
Neutral
222
-
1,330
1,488
1,681
11.7
11.9
6.4
7.2
34.6
30.9
3.7
3.3
10.8
11.4
1.1
1.0
Indag Rubber
Neutral
212
-
557
286
326
19.8
16.8
11.7
13.3
18.2
15.9
3.1
2.9
17.8
17.1
1.6
1.4
Capital Goods
ACE
Neutral
66
-
653
709
814
4.1
4.6
1.4
2.1
47.1
31.4
1.9
1.8
4.4
6.0
1.1
0.9
Stock Watch
April 10, 2017
Company Name
Reco
CMP
Target
Mkt Cap
Sales ( Čcr )
OPM(%)
EPS (Č)
PER(x)
P/BV(x)
RoE(%)
EV/Sales(x)
(Č)
Price ( Č)
( Č cr )
FY17E
FY18E
FY17E
FY18E
FY17E
FY18E
FY17E
FY18E
FY17E
FY18E
FY17E
FY18E
FY17E
FY18E
Capital Goods
BEML
Neutral
1,363
-
5,675
3,451
4,055
6.3
9.2
31.4
57.9
43.4
23.5
2.6
2.4
6.3
10.9
1.8
1.5
Bharat Electronics
Neutral
168
-
37,447
8,137
9,169
16.8
17.2
58.7
62.5
2.9
2.7
0.4
0.4
44.6
46.3
3.6
3.2
Voltas
Neutral
410
-
13,561
6,511
7,514
7.9
8.7
12.9
16.3
31.8
25.1
5.7
5.0
16.7
18.5
1.8
1.6
BGR Energy
Neutral
171
-
1,233
16,567
33,848
6.0
5.6
7.8
5.9
21.9
29.0
1.3
1.2
4.7
4.2
0.2
0.1
BHEL
Neutral
175
-
42,796
28,797
34,742
-
2.8
2.3
6.9
76.0
25.3
1.3
1.3
1.3
4.8
1.1
0.8
Blue Star
Accumulate
661
760
6,320
4,283
5,077
5.9
7.3
14.9
22.1
44.4
29.9
8.6
7.3
20.4
26.4
1.5
1.3
CG Power and Industrial
Neutral
79
-
4,948
5,777
6,120
5.9
7.0
3.3
4.5
23.9
17.5
1.1
1.0
4.4
5.9
0.8
0.7
Solutions
Greaves Cotton
Neutral
167
-
4,071
1,755
1,881
16.8
16.9
7.8
8.5
21.4
19.6
4.3
4.0
20.6
20.9
2.0
1.8
Inox Wind
Neutral
185
-
4,112
5,605
6,267
15.7
16.4
24.8
30.0
7.5
6.2
2.1
1.5
25.9
24.4
0.8
0.6
KEC International
Neutral
214
-
5,506
9,294
10,186
7.9
8.1
9.9
11.9
21.6
18.0
3.2
2.8
15.6
16.3
0.8
0.7
KEI Industries
Accumulate
191
207
1,487
2,682
3,058
10.4
10.0
11.7
12.8
16.3
14.9
3.3
2.7
20.1
18.2
0.8
0.7
Thermax
Neutral
974
-
11,608
5,421
5,940
7.3
7.3
25.7
30.2
37.9
32.3
4.6
4.2
12.2
13.1
2.0
1.9
VATech Wabag
Neutral
676
-
3,689
3,136
3,845
8.9
9.1
26.0
35.9
26.0
18.8
3.3
2.8
13.4
15.9
1.1
0.9
Cement
ACC
Neutral
1,467
-
27,545
11,225
13,172
13.2
16.9
44.5
75.5
33.0
19.4
3.1
2.9
11.2
14.2
2.5
2.1
Ambuja Cements
Neutral
242
-
48,122
9,350
10,979
18.2
22.5
5.8
9.5
41.8
25.5
3.5
3.2
10.2
12.5
5.2
4.4
India Cements
Neutral
163
-
4,999
4,364
4,997
18.5
19.2
7.9
11.3
20.6
14.4
1.5
1.4
8.0
8.5
1.9
1.7
JK Cement
Neutral
927
-
6,482
4,398
5,173
15.5
17.5
31.2
55.5
29.7
16.7
3.6
3.1
12.0
15.5
2.0
1.7
J K Lakshmi Cement
Neutral
451
-
5,310
2,913
3,412
14.5
19.5
7.5
22.5
60.2
20.1
3.7
3.1
12.5
18.0
2.4
2.0
Orient Cement
Neutral
143
-
2,931
2,114
2,558
18.5
20.5
8.1
11.3
17.7
12.7
2.6
2.2
9.0
14.0
2.0
1.6
UltraTech Cement
Neutral
4,085
-
112,124
25,768
30,385
21.0
23.5
111.0
160.0
36.8
25.5
4.7
4.1
13.5
15.8
4.4
3.7
Construction
ITNL
Neutral
111
-
3,645
8,946
10,017
31.0
31.6
8.1
9.1
13.7
12.2
0.5
0.5
4.2
5.0
3.7
3.5
KNR Constructions
Neutral
195
-
2,736
1,385
1,673
14.7
14.0
41.2
48.5
4.7
4.0
0.9
0.8
14.9
15.2
2.1
1.7
Larsen & Toubro
Neutral
1,687
-
157,345
111,017
124,908
11.0
11.0
61.1
66.7
27.6
25.3
3.3
3.1
13.1
12.9
2.5
2.3
Gujarat Pipavav Port
Neutral
166
-
8,013
705
788
52.2
51.7
5.0
5.6
33.2
29.6
3.3
2.9
11.2
11.2
11.0
9.4
Nagarjuna Const.
Neutral
85
-
4,703
8,842
9,775
9.1
8.8
5.3
6.4
16.0
13.2
1.3
1.2
8.2
9.1
0.7
0.6
PNC Infratech
Accumulate
127
143
3,270
2,350
2,904
13.1
13.2
9.0
8.8
14.2
14.5
0.5
0.5
15.9
13.9
1.5
1.2
Simplex Infra
Neutral
372
-
1,840
6,829
7,954
10.5
10.5
31.4
37.4
11.8
9.9
1.2
1.1
9.9
13.4
0.7
0.6
Power Mech Projects
Neutral
531
-
781
1,801
2,219
12.7
14.6
72.1
113.9
7.4
4.7
1.4
1.2
16.8
11.9
0.4
0.3
Sadbhav Engineering
Neutral
317
-
5,430
3,598
4,140
10.3
10.6
9.0
11.9
35.2
26.6
3.7
3.2
9.9
11.9
1.8
1.5
Stock Watch
April 10, 2017
Company Name
Reco
CMP
Target
Mkt Cap
Sales ( Čcr )
OPM(%)
EPS (Č)
PER(x)
P/BV(x)
RoE(%)
EV/Sales(x)
(Č)
Price ( Č)
( Č cr )
FY17E
FY18E
FY17E
FY18E
FY17E
FY18E
FY17E
FY18E
FY17E
FY18E
FY17E
FY18E
FY17E
FY18E
Construction
NBCC
Neutral
177
-
15,939
7,428
9,549
7.9
8.6
8.2
11.0
21.6
16.1
1.1
0.9
28.2
28.7
1.9
1.4
MEP Infra
Neutral
63
-
1,022
1,877
1,943
30.6
29.8
3.0
4.2
21.0
15.0
10.1
6.8
0.6
0.6
1.9
1.8
SIPL
Neutral
100
-
3,536
1,036
1,252
65.5
66.2
(8.4)
(5.6)
3.8
4.3
(22.8)
(15.9)
11.6
9.7
Engineers India
Neutral
150
-
10,115
1,725
1,935
16.0
19.1
11.4
13.9
13.2
10.8
1.8
1.8
13.4
15.3
4.8
4.3
Financials
Axis Bank
Buy
504
580
120,646
46,932
53,575
3.5
3.4
32.4
44.6
15.6
11.3
2.0
1.7
13.6
16.5
-
-
Bank of Baroda
Neutral
169
-
38,871
19,980
23,178
1.8
1.8
11.5
17.3
14.7
9.8
1.7
1.4
8.3
10.1
-
-
Canara Bank
Neutral
305
-
16,537
15,225
16,836
1.8
1.8
14.5
28.0
21.0
10.9
1.5
1.2
5.8
8.5
-
-
Can Fin Homes
Neutral
2,339
-
6,227
420
526
3.5
3.5
86.5
107.8
27.0
21.7
5.8
4.8
23.6
24.1
-
-
Cholamandalam Inv. &
Buy
1,005
1,230
15,698
2,012
2,317
6.3
6.3
42.7
53.6
23.5
18.7
3.7
3.2
16.9
18.3
-
-
Fin. Co.
Dewan Housing Finance Buy
383
460
12,006
2,225
2,688
2.9
2.9
29.7
34.6
12.9
11.1
2.1
1.4
16.1
14.8
-
-
Equitas Holdings
Buy
165
235
5,586
939
1,281
11.7
11.5
5.8
8.2
28.5
20.2
2.5
2.2
10.9
11.5
-
-
Federal Bank
Neutral
88
-
15,137
8,259
8,995
3.0
3.0
4.3
5.6
20.4
15.7
1.7
1.6
8.5
10.1
-
-
HDFC
Neutral
1,484
-
235,758
11,475
13,450
3.4
3.4
45.3
52.5
32.8
28.3
6.3
5.6
20.2
20.5
-
-
HDFC Bank
Neutral
1,439
-
368,686
46,097
55,433
4.5
4.5
58.4
68.0
24.6
21.2
4.3
3.6
18.8
18.6
-
-
ICICI Bank
Accumulate
277
315
161,355
42,800
44,686
3.1
3.3
18.0
21.9
15.4
12.7
2.1
1.9
11.1
12.3
-
-
Karur Vysya Bank
Buy
114
140
6,877
5,640
6,030
3.3
3.2
8.9
10.0
12.8
11.4
1.4
1.3
11.2
11.4
-
-
Lakshmi Vilas Bank
Neutral
167
-
3,188
3,339
3,799
2.7
2.8
11.0
14.0
15.1
11.9
1.6
1.4
11.2
12.7
-
-
LIC Housing Finance
Neutral
625
-
31,521
3,712
4,293
2.6
2.5
39.0
46.0
16.0
13.6
3.0
2.6
19.9
20.1
-
-
Punjab Natl.Bank
Neutral
149
-
31,685
23,532
23,595
2.3
2.4
6.8
12.6
21.9
11.8
3.4
2.4
3.3
6.5
-
-
RBL Bank
Neutral
556
-
20,543
1,783
2,309
2.6
2.6
12.7
16.4
43.7
33.9
4.8
4.3
12.8
13.3
-
-
Repco Home Finance
Buy
694
825
4,343
388
457
4.5
4.2
30.0
38.0
23.1
18.3
3.9
3.2
18.0
19.2
-
-
South Ind.Bank
Neutral
22
-
3,903
6,435
7,578
2.5
2.5
2.7
3.1
8.0
7.0
1.0
0.9
10.1
11.2
-
-
St Bk of India
Neutral
289
-
230,753
88,650
98,335
2.6
2.6
13.5
18.8
21.4
15.4
2.0
1.8
7.0
8.5
-
-
Union Bank
Neutral
152
-
10,428
13,450
14,925
2.3
2.3
25.5
34.5
6.0
4.4
0.9
0.7
7.5
10.2
-
-
Yes Bank
Neutral
1,553
-
70,895
8,978
11,281
3.3
3.4
74.0
90.0
21.0
17.3
4.0
3.4
17.0
17.2
-
-
FMCG
Akzo Nobel India
Neutral
1,870
-
8,968
2,955
3,309
13.3
13.7
57.2
69.3
32.7
27.0
10.7
9.0
32.7
33.3
2.8
2.5
Asian Paints
Neutral
1,081
-
103,656
17,128
18,978
16.8
16.4
19.1
20.7
56.6
52.2
19.7
18.6
34.8
35.5
6.0
5.4
Britannia
Accumulate
3,349
3,626
40,186
9,594
11,011
14.6
14.9
80.3
94.0
41.7
35.6
17.2
13.2
41.2
-
4.1
3.5
Colgate
Neutral
1,012
-
27,522
4,605
5,149
23.4
23.4
23.8
26.9
42.5
37.6
23.5
18.4
64.8
66.8
5.9
5.3
Stock Watch
April 10, 2017
Company Name
Reco
CMP
Target
Mkt Cap
Sales ( Čcr )
OPM(%)
EPS (Č)
PER(x)
P/BV(x)
RoE(%)
EV/Sales(x)
(Č)
Price ( Č)
( Č cr )
FY17E FY18E
FY17E
FY18E
FY17E
FY18E
FY17E
FY18E
FY17E
FY18E
FY17E
FY18E
FY17E
FY18E
FMCG
Dabur India
Accumulate
281
304
49,578
8,315
9,405
19.8
20.7
8.1
9.2
34.8
30.6
9.7
8.0
31.6
31.0
5.6
4.9
GlaxoSmith Con*
Neutral
5,202
-
21,876
4,350
4,823
21.2
21.4
179.2
196.5
29.0
26.5
7.7
6.5
27.1
26.8
4.4
3.9
Godrej Consumer
Neutral
1,698
-
57,836
10,235
11,428
18.4
18.6
41.1
44.2
41.3
38.4
9.2
7.7
24.9
24.8
5.7
5.1
HUL
Neutral
923
-
199,802
35,252
38,495
17.8
17.8
20.7
22.4
44.7
41.2
42.7
36.7
95.6
88.9
5.5
5.0
ITC
Neutral
273
-
331,320
40,059
44,439
38.3
39.2
9.0
10.1
30.4
26.9
8.5
7.4
27.8
27.5
7.8
7.0
Marico
Neutral
299
-
38,598
6,430
7,349
18.8
19.5
6.4
7.7
46.7
38.8
14.1
11.9
33.2
32.5
5.8
5.0
Nestle*
Neutral
6,608
-
63,707
10,073
11,807
20.7
21.5
124.8
154.2
52.9
42.9
21.7
19.6
34.8
36.7
6.1
5.2
Tata Global
Neutral
151
-
9,505
8,675
9,088
9.8
9.8
7.4
8.2
20.4
18.4
1.6
1.5
7.9
8.1
1.0
1.0
Procter & Gamble
Neutral
7,350
-
23,859
2,939
3,342
23.2
23.0
146.2
163.7
50.3
44.9
12.7
10.6
25.3
23.5
7.7
6.7
Hygiene
IT
HCL Tech^
Buy
849
1,000
119,813
49,242
57,168
20.5
20.5
55.7
64.1
15.2
13.2
3.1
2.4
20.3
17.9
2.3
1.9
Infosys
Buy
981
1,249
225,388
68,350
77,326
27.0
27.0
62.5
69.4
15.7
14.1
3.4
3.1
21.3
21.6
2.7
2.4
TCS
Accumulate
2,427
2,700
478,243
119,025
133,308
27.6
27.6
131.2
145.5
18.5
16.7
6.0
5.5
32.4
33.1
3.8
3.3
Tech Mahindra
Buy
443
600
43,172
29,673
32,937
15.5
17.0
32.8
39.9
13.5
11.1
2.7
2.3
19.6
20.7
1.2
1.0
Wipro
Accumulate
512
583
124,401
55,440
60,430
18.1
18.1
36.1
38.9
14.2
13.2
2.6
2.4
19.0
17.6
2.0
1.7
Media
D B Corp
Neutral
390
-
7,163
2,297
2,590
27.4
28.2
21.0
23.4
18.6
16.7
4.3
3.8
23.7
23.1
2.9
2.5
HT Media
Neutral
85
-
1,988
2,693
2,991
12.6
12.9
7.9
9.0
10.8
9.5
0.9
0.9
7.8
8.3
0.3
0.2
Jagran Prakashan
Buy
187
225
6,105
2,355
2,635
28.0
28.0
10.8
12.5
17.3
14.9
3.8
3.2
21.7
21.7
2.6
2.3
Sun TV Network
Neutral
774
-
30,486
2,850
3,265
70.1
71.0
26.2
30.4
29.5
25.5
7.6
6.7
24.3
25.6
10.3
8.8
Hindustan Media
Neutral
289
-
2,120
1,016
1,138
24.3
25.2
27.3
30.1
10.6
9.6
2.0
1.8
16.2
15.8
1.4
1.2
Ventures
TV Today Network
Buy
277
344
1,655
567
645
26.7
27.0
15.4
18.1
18.1
15.3
2.7
2.3
14.9
15.2
2.5
2.1
Metals & Mining
Coal India
Neutral
284
-
176,259
84,638
94,297
21.4
22.3
24.5
27.1
11.6
10.5
4.8
4.6
42.6
46.0
1.6
1.4
Hind. Zinc
Neutral
284
-
119,936
14,252
18,465
55.9
48.3
15.8
21.5
18.0
13.2
2.9
2.6
17.0
20.7
8.4
6.5
Hindalco
Neutral
194
-
43,407
107,899
112,095
7.4
8.2
9.2
13.0
21.0
14.9
1.0
1.0
4.8
6.6
0.9
0.9
JSW Steel
Neutral
200
-
48,236
53,201
58,779
16.1
16.2
130.6
153.7
1.5
1.3
0.2
0.2
14.0
14.4
1.7
1.5
NMDC
Neutral
135
-
42,760
6,643
7,284
44.4
47.7
7.1
7.7
19.0
17.6
1.7
1.6
8.8
9.2
4.2
3.8
SAIL
Neutral
66
-
27,424
47,528
53,738
(0.7)
2.1
(1.9)
2.6
25.5
0.7
0.7
(1.6)
3.9
1.4
1.3
Vedanta
Neutral
269
-
79,691
71,744
81,944
19.2
21.7
13.4
20.1
20.1
13.4
1.7
1.5
8.4
11.3
1.5
1.2
Tata Steel
Neutral
493
-
47,871
121,374
121,856
7.2
8.4
18.6
34.3
26.5
14.4
1.7
1.5
6.1
10.1
1.0
1.0
Oil & Gas
Cairn India
Neutral
299
-
56,174
9,127
10,632
4.3
20.6
8.8
11.7
34.0
25.6
1.1
1.1
3.3
4.2
7.6
6.4
Stock Watch
April 10, 2017
Company Name
Reco
CMP
Target
Mkt Cap
Sales ( Čcr )
OPM(%)
EPS (Č)
PER(x)
P/BV(x)
RoE(%)
EV/Sales(x)
(Č)
Price ( Č)
( Č cr )
FY17E FY18E
FY17E
FY18E
FY17E
FY18E
FY17E
FY18E
FY17E
FY18E
FY17E
FY18E
FY17E
FY18E
Oil & Gas
GAIL
Neutral
387
-
65,377
56,220
65,198
9.3
10.1
27.1
33.3
14.3
11.6
1.3
1.2
9.3
10.7
1.4
1.1
ONGC
Neutral
186
-
239,147
137,222
152,563
15.0
21.8
19.5
24.1
9.6
7.7
0.8
0.8
8.5
10.1
2.0
1.8
Indian Oil Corp
Neutral
397
-
192,949
373,359
428,656
5.9
5.5
54.0
59.3
7.4
6.7
1.1
1.0
16.0
15.6
0.7
0.6
Reliance Industries
Neutral
1,406
-
456,983
301,963
358,039
12.1
12.6
87.7
101.7
16.0
13.8
1.6
1.5
10.7
11.3
2.0
1.7
Pharmaceuticals
Alembic Pharma
Accumulate
621
689
11,708
3,483
4,244
20.2
21.4
24.3
33.6
25.6
18.5
5.8
4.6
25.5
25.3
3.3
2.6
Alkem Laboratories Ltd
Neutral
2,202
-
26,328
6,065
7,009
18.7
20.0
80.2
92.0
27.5
23.9
6.2
5.2
22.5
21.6
4.3
3.7
Aurobindo Pharma
Buy
659
877
38,613
15,720
18,078
23.7
23.7
41.4
47.3
15.9
13.9
4.1
3.2
29.6
26.1
2.7
2.3
Aventis*
Neutral
4,632
-
10,668
2,277
2,597
16.6
17.4
128.9
157.0
35.9
29.5
6.1
4.7
21.6
26.4
4.5
3.7
Cadila Healthcare
Neutral
455
-
46,565
10,429
12,318
17.7
21.6
13.1
19.2
34.7
23.7
7.3
5.8
22.8
27.1
4.5
3.7
Cipla
Sell
589
465
47,366
15,378
18,089
15.7
16.8
19.3
24.5
30.5
24.0
3.6
3.2
12.3
13.9
3.2
2.7
Dr Reddy's
Neutral
2,658
-
44,032
16,043
18,119
18.0
23.0
78.6
130.9
33.8
20.3
3.3
2.9
10.1
15.2
2.5
2.4
Dishman Pharma
Sell
327
143
5,275
1,718
1,890
22.7
22.8
9.5
11.3
34.4
28.9
3.3
3.0
10.1
10.9
3.5
3.1
GSK Pharma*
Neutral
2,726
-
23,088
2,800
3,290
10.2
20.6
32.2
60.3
84.7
45.2
15.7
15.5
17.2
34.5
8.0
6.9
Indoco Remedies
Neutral
238
-
2,189
1,112
1,289
16.2
18.2
11.6
16.0
20.5
14.8
3.3
2.8
17.0
20.1
2.1
1.7
Ipca labs
Neutral
638
-
8,050
3,258
3,747
12.8
15.3
12.1
19.2
52.7
33.2
3.3
3.0
6.4
9.5
2.6
2.3
Lupin
Buy
1,410
1,809
63,688
15,912
18,644
26.4
26.7
58.1
69.3
24.3
20.4
4.7
3.9
21.4
20.9
4.1
3.3
Sun Pharma
Buy
666
847
159,705
31,129
35,258
32.0
32.9
30.2
35.3
22.0
18.9
3.6
3.0
20.0
20.1
4.7
4.0
Power
Tata Power
Neutral
88
-
23,667
36,916
39,557
17.4
27.1
5.1
6.3
17.2
13.9
1.5
1.4
9.0
10.3
1.7
1.5
NTPC
Neutral
168
-
138,276
86,605
95,545
17.5
20.8
11.8
13.4
14.2
12.5
1.4
1.4
10.5
11.1
2.9
2.9
Power Grid
Accumulate
195
223
102,147
25,315
29,193
88.2
88.7
14.2
17.2
13.8
11.4
2.1
1.8
15.2
16.1
8.7
7.8
Real Estate
Prestige Estate
Neutral
221
-
8,301
4,707
5,105
25.2
26.0
10.3
13.0
21.5
17.0
1.7
1.6
10.3
10.2
2.9
2.6
MLIFE
Buy
407
522
1,673
1,152
1,300
22.7
24.6
29.9
35.8
13.6
11.4
1.0
1.0
7.6
8.6
2.2
1.8
Telecom
Bharti Airtel
Neutral
345
-
137,710
105,086
114,808
34.5
34.7
12.2
16.4
28.2
21.0
1.9
1.8
6.8
8.4
2.2
1.9
Idea Cellular
Neutral
87
-
31,475
40,133
43,731
37.2
37.1
6.4
6.5
13.6
13.4
1.1
1.1
8.2
7.6
1.8
1.5
zOthers
Abbott India
Neutral
4,770
-
10,136
3,153
3,583
14.1
14.4
152.2
182.7
31.3
26.1
153.9
131.4
25.6
26.1
2.9
2.5
Asian Granito
Neutral
378
-
1,137
1,060
1,169
12.2
12.5
12.7
15.9
29.8
23.8
2.8
2.5
9.5
10.7
1.4
1.2
Bajaj Electricals
Accumulate
344
395
3,480
4,801
5,351
5.7
6.2
10.4
13.7
33.0
25.1
4.1
3.6
12.4
14.5
0.7
0.6
Banco Products (India)
Neutral
222
-
1,586
1,353
1,471
12.3
12.4
14.5
16.3
15.3
13.6
21.1
19.0
14.5
14.6
1.1
119.5
Coffee Day Enterprises
Neutral
232
-
4,774
2,964
3,260
20.5
21.2
4.7
8.0
-
29.0
2.7
2.5
5.5
8.5
2.0
1.8
Ltd
Stock Watch
April 10, 2017
Company Name
Reco
CMP
Target
Mkt Cap
Sales ( Čcr )
OPM(%)
EPS (Č)
PER(x)
P/BV(x)
RoE(%)
EV/Sales(x)
(Č)
Price ( Č)
( Č cr )
FY17E
FY18E
FY17E
FY18E
FY17E
FY18E
FY17E
FY18E
FY17E
FY18E
FY17E
FY18E
FY17E
FY18E
zOthers
Competent Automobiles Neutral
224
-
137
1,137
1,256
3.1
2.7
28.0
23.6
8.0
9.5
43.0
38.9
14.3
11.5
0.1
0.1
Elecon Engineering
Neutral
58
-
646
1,482
1,660
13.7
14.5
3.9
5.8
14.8
9.9
3.5
3.2
7.8
10.9
0.8
0.7
Finolex Cables
Neutral
516
-
7,899
2,883
3,115
12.0
12.1
14.2
18.6
36.4
27.8
19.3
16.9
15.8
14.6
2.4
2.2
Garware Wall Ropes
Neutral
694
-
1,519
863
928
15.1
15.2
36.4
39.4
19.1
17.6
3.5
2.9
17.5
15.9
1.7
1.5
Goodyear India*
Neutral
900
-
2,076
1,598
1,704
10.4
10.2
49.4
52.6
18.2
17.1
84.1
73.8
18.2
17.0
1.0
140.7
Hitachi
Neutral
1,797
-
4,885
2,081
2,433
8.8
8.9
33.4
39.9
53.8
45.0
43.4
36.2
22.1
21.4
2.3
2.0
HSIL
Neutral
353
-
2,550
2,384
2,515
15.8
16.3
15.3
19.4
23.1
18.2
22.9
19.7
7.8
9.3
1.2
1.1
Interglobe Aviation
Neutral
1,039
-
37,549
21,122
26,005
14.5
27.6
110.7
132.1
9.4
7.9
56.2
40.1
168.5
201.1
1.8
1.4
Jyothy Laboratories
Neutral
341
-
6,195
1,440
2,052
11.5
13.0
8.5
10.0
40.1
34.1
9.7
9.0
18.6
19.3
4.6
3.2
Kirloskar Engines India
Neutral
400
-
5,785
2,554
2,800
9.9
10.0
10.5
12.1
38.1
33.1
15.9
15.0
10.7
11.7
1.9
1.7
Ltd
Linc Pen & Plastics
Neutral
283
-
419
382
420
9.3
9.5
13.5
15.7
21.0
18.0
3.6
3.1
17.1
17.3
1.2
1.0
M M Forgings
Neutral
557
-
672
546
608
20.4
20.7
41.3
48.7
13.5
11.4
76.3
67.5
16.6
17.0
1.1
1.0
Manpasand Bever.
Neutral
707
-
4,042
836
1,087
19.6
19.4
16.9
23.8
41.8
29.7
5.0
4.4
12.0
14.8
4.6
3.4
Mirza International
Buy
87
107
1,045
963
1,069
17.2
18.0
6.1
7.5
14.2
11.6
2.2
1.8
15.0
15.7
1.3
1.2
MT Educare
Neutral
82
-
326
366
417
17.7
18.2
9.4
10.8
8.8
7.6
1.9
1.7
22.2
22.3
0.8
0.7
Narayana Hrudaya
Neutral
324
-
6,622
1,873
2,166
11.5
11.7
2.6
4.0
122.5
81.7
7.5
6.8
6.1
8.3
3.6
3.1
Navkar Corporation
Buy
209
265
2,987
369
561
42.9
42.3
6.9
11.5
30.3
18.2
2.1
1.9
7.4
10.5
9.1
6.0
Navneet Education
Neutral
162
-
3,792
1,062
1,147
24.0
24.0
6.1
6.6
26.7
24.5
5.5
4.9
20.6
19.8
3.7
3.4
Nilkamal
Neutral
1,993
-
2,974
1,995
2,165
10.7
10.4
69.8
80.6
28.6
24.7
113.9
98.9
16.6
16.5
1.5
1.3
Page Industries
Neutral
14,345
-
16,000
2,450
3,124
20.1
17.6
299.0
310.0
48.0
46.3
319.5
243.9
47.1
87.5
6.6
5.2
Parag Milk Foods
Neutral
244
-
2,052
1,919
2,231
9.3
9.6
9.5
12.9
25.8
18.9
4.0
3.3
15.5
17.5
1.2
1.0
Quick Heal
Neutral
253
-
1,773
408
495
27.3
27.0
7.7
8.8
32.7
28.8
3.0
3.0
9.3
10.6
3.5
2.9
Radico Khaitan
Buy
124
147
1,648
1,667
1,824
13.0
13.2
6.7
8.2
18.6
15.1
1.7
1.5
9.0
10.2
1.4
1.2
Relaxo Footwears
Neutral
493
-
5,921
2,085
2,469
9.2
8.2
7.6
8.0
65.2
62.0
25.3
21.6
17.9
18.8
2.9
2.5
S H Kelkar & Co.
Neutral
307
-
4,439
1,036
1,160
15.1
15.0
6.1
7.2
50.3
42.8
5.4
4.9
10.7
11.5
4.2
3.7
Siyaram Silk Mills
Accumulate
1,692
1,872
1,586
1,652
1,857
11.6
11.7
92.4
110.1
18.3
15.4
2.7
2.3
14.7
15.2
1.2
1.0
Styrolution ABS India*
Neutral
746
-
1,312
1,440
1,537
9.2
9.0
40.6
42.6
18.4
17.5
46.9
42.7
12.3
11.6
0.9
0.8
Surya Roshni
Neutral
209
-
917
3,342
3,625
7.8
7.5
17.3
19.8
12.1
10.6
23.0
18.5
10.5
10.8
0.5
0.5
Team Lease Serv.
Neutral
1,025
-
1,752
3,229
4,001
1.5
1.8
22.8
32.8
45.0
31.2
4.8
4.2
10.7
13.4
0.4
0.3
Stock Watch
April 10, 2017
Company Name
Reco
CMP
Target Mkt Cap
Sales ( Čcr )
OPM(%)
EPS (Č)
PER(x)
P/BV(x)
RoE(%)
EV/Sales(x)
(Č)
Price ( Č)
( Č cr )
FY17E FY18E FY17E FY18E FY17E FY18E FY17E FY18E FY17E FY18E FY17E FY18E FY17E FY18E
zOthers
The Byke Hospitality
Neutral
185
-
741
287
384
20.5
20.5
7.6
10.7
24.3
17.3
5.1
4.1
20.7
23.5
2.6
1.9
Transport Corporation of
Neutral
231
-
1,767
2,671
2,911
8.5
8.8
13.9
15.7
16.7
14.7
2.3
2.0
13.7
13.8
0.8
0.7
India
TVS Srichakra
Neutral
3,645
-
2,791
2,304
2,614
13.7
13.8
231.1
266.6
15.8
13.7
409.6
322.5
33.9
29.3
1.2
1.0
UFO Moviez
Neutral
450
-
1,241
619
685
33.2
33.4
30.0
34.9
15.0
12.9
2.1
1.8
13.8
13.9
1.7
1.4
Visaka Industries
Neutral
315
-
500
1,051
1,138
10.3
10.4
21.0
23.1
15.0
13.6
40.4
37.8
9.0
9.2
0.7
0.7
VRL Logistics
Neutral
341
-
3,114
1,902
2,119
16.7
16.6
14.6
16.8
23.4
20.3
5.1
4.5
21.9
22.2
1.8
1.5
VIP Industries
Neutral
201
-
2,842
1,270
1,450
10.4
10.4
5.6
6.5
35.9
30.9
7.5
6.5
20.7
21.1
2.2
2.0
Navin Fluorine
Buy
3,111
3,650
3,046
789
945
21.1
22.4
120.1
143.4
25.9
21.7
4.2
3.6
17.8
18.5
3.8
3.1
Source: Company, Angel Research; Note: *December year end; #September year end; &October year end; Price as on April 07, 2017
Market Outlook
April 10, 2017
Research Team Tel: 022 - 39357800
DISCLAIMER
Angel Broking Private Limited (hereinafter referred to as “Angel”) is a registered Member of National Stock Exchange of India
Limited,Bombay Stock Exchange Limited and Metropolitan Stock Exchange Limited. It is also registered as a Depository Participant with
CDSL and Portfolio Manager with SEBI. It also has registration with AMFI as a Mutual Fund Distributor. Angel Broking Private Limited is a
registered entity with SEBI for Research Analyst in terms of SEBI (Research Analyst) Regulations, 2014 vide registration number
INH000000164. Angel or its associates has not been debarred/ suspended by SEBI or any other regulatory authority for accessing
/dealing in securities Market. Angel or its associates/analyst has not received any compensation / managed or
co-managed public offering of securities of the company covered by Analyst during the past twelve months.
This document is solely for the personal information of the recipient, and must not be singularly used as the basis of any investment
decision. Nothing in this document should be construed as investment or financial advice. Each recipient of this document should make
such investigations as they deem necessary to arrive at an independent evaluation of an investment in the securities of the companies
referred to in this document (including the merits and risks involved), and should consult their own advisors to determine the merits and
risks of such an investment.
Reports based on technical and derivative analysis center on studying charts of a stock's price movement, outstanding positions and
trading volume, as opposed to focusing on a company's fundamentals and, as such, may not match with a report on a company's
fundamentals. Investors are advised to refer the Fundamental and Technical Research Reports available on our website to evaluate the
contrary view, if any.
The information in this document has been printed on the basis of publicly available information, internal data and other reliable
sources believed to be true, but we do not represent that it is accurate or complete and it should not be relied on as such, as this
document is for general guidance only. Angel Broking Pvt. Limited or any of its affiliates/ group companies shall not be in any way
responsible for any loss or damage that may arise to any person from any inadvertent error in the information contained in this report.
Angel Broking Pvt. Limited has not independently verified all the information contained within this document. Accordingly, we cannot
testify, nor make any representation or warranty, express or implied, to the accuracy, contents or data contained within this document.
While Angel Broking Pvt. Limited endeavors to update on a reasonable basis the information discussed in this material, there may be
regulatory, compliance, or other reasons that prevent us from doing so.
This document is being supplied to you solely for your information, and its contents, information or data may not be reproduced,
redistributed or passed on, directly or indirectly.
Neither Angel Broking Pvt. Limited, nor its directors, employees or affiliates shall be liable for any loss or damage that may arise from
or in connection with the use of this information.